Treadmill Pace Chart: MPH to Pace by Incline (PDF)

Treadmill Pace Chart

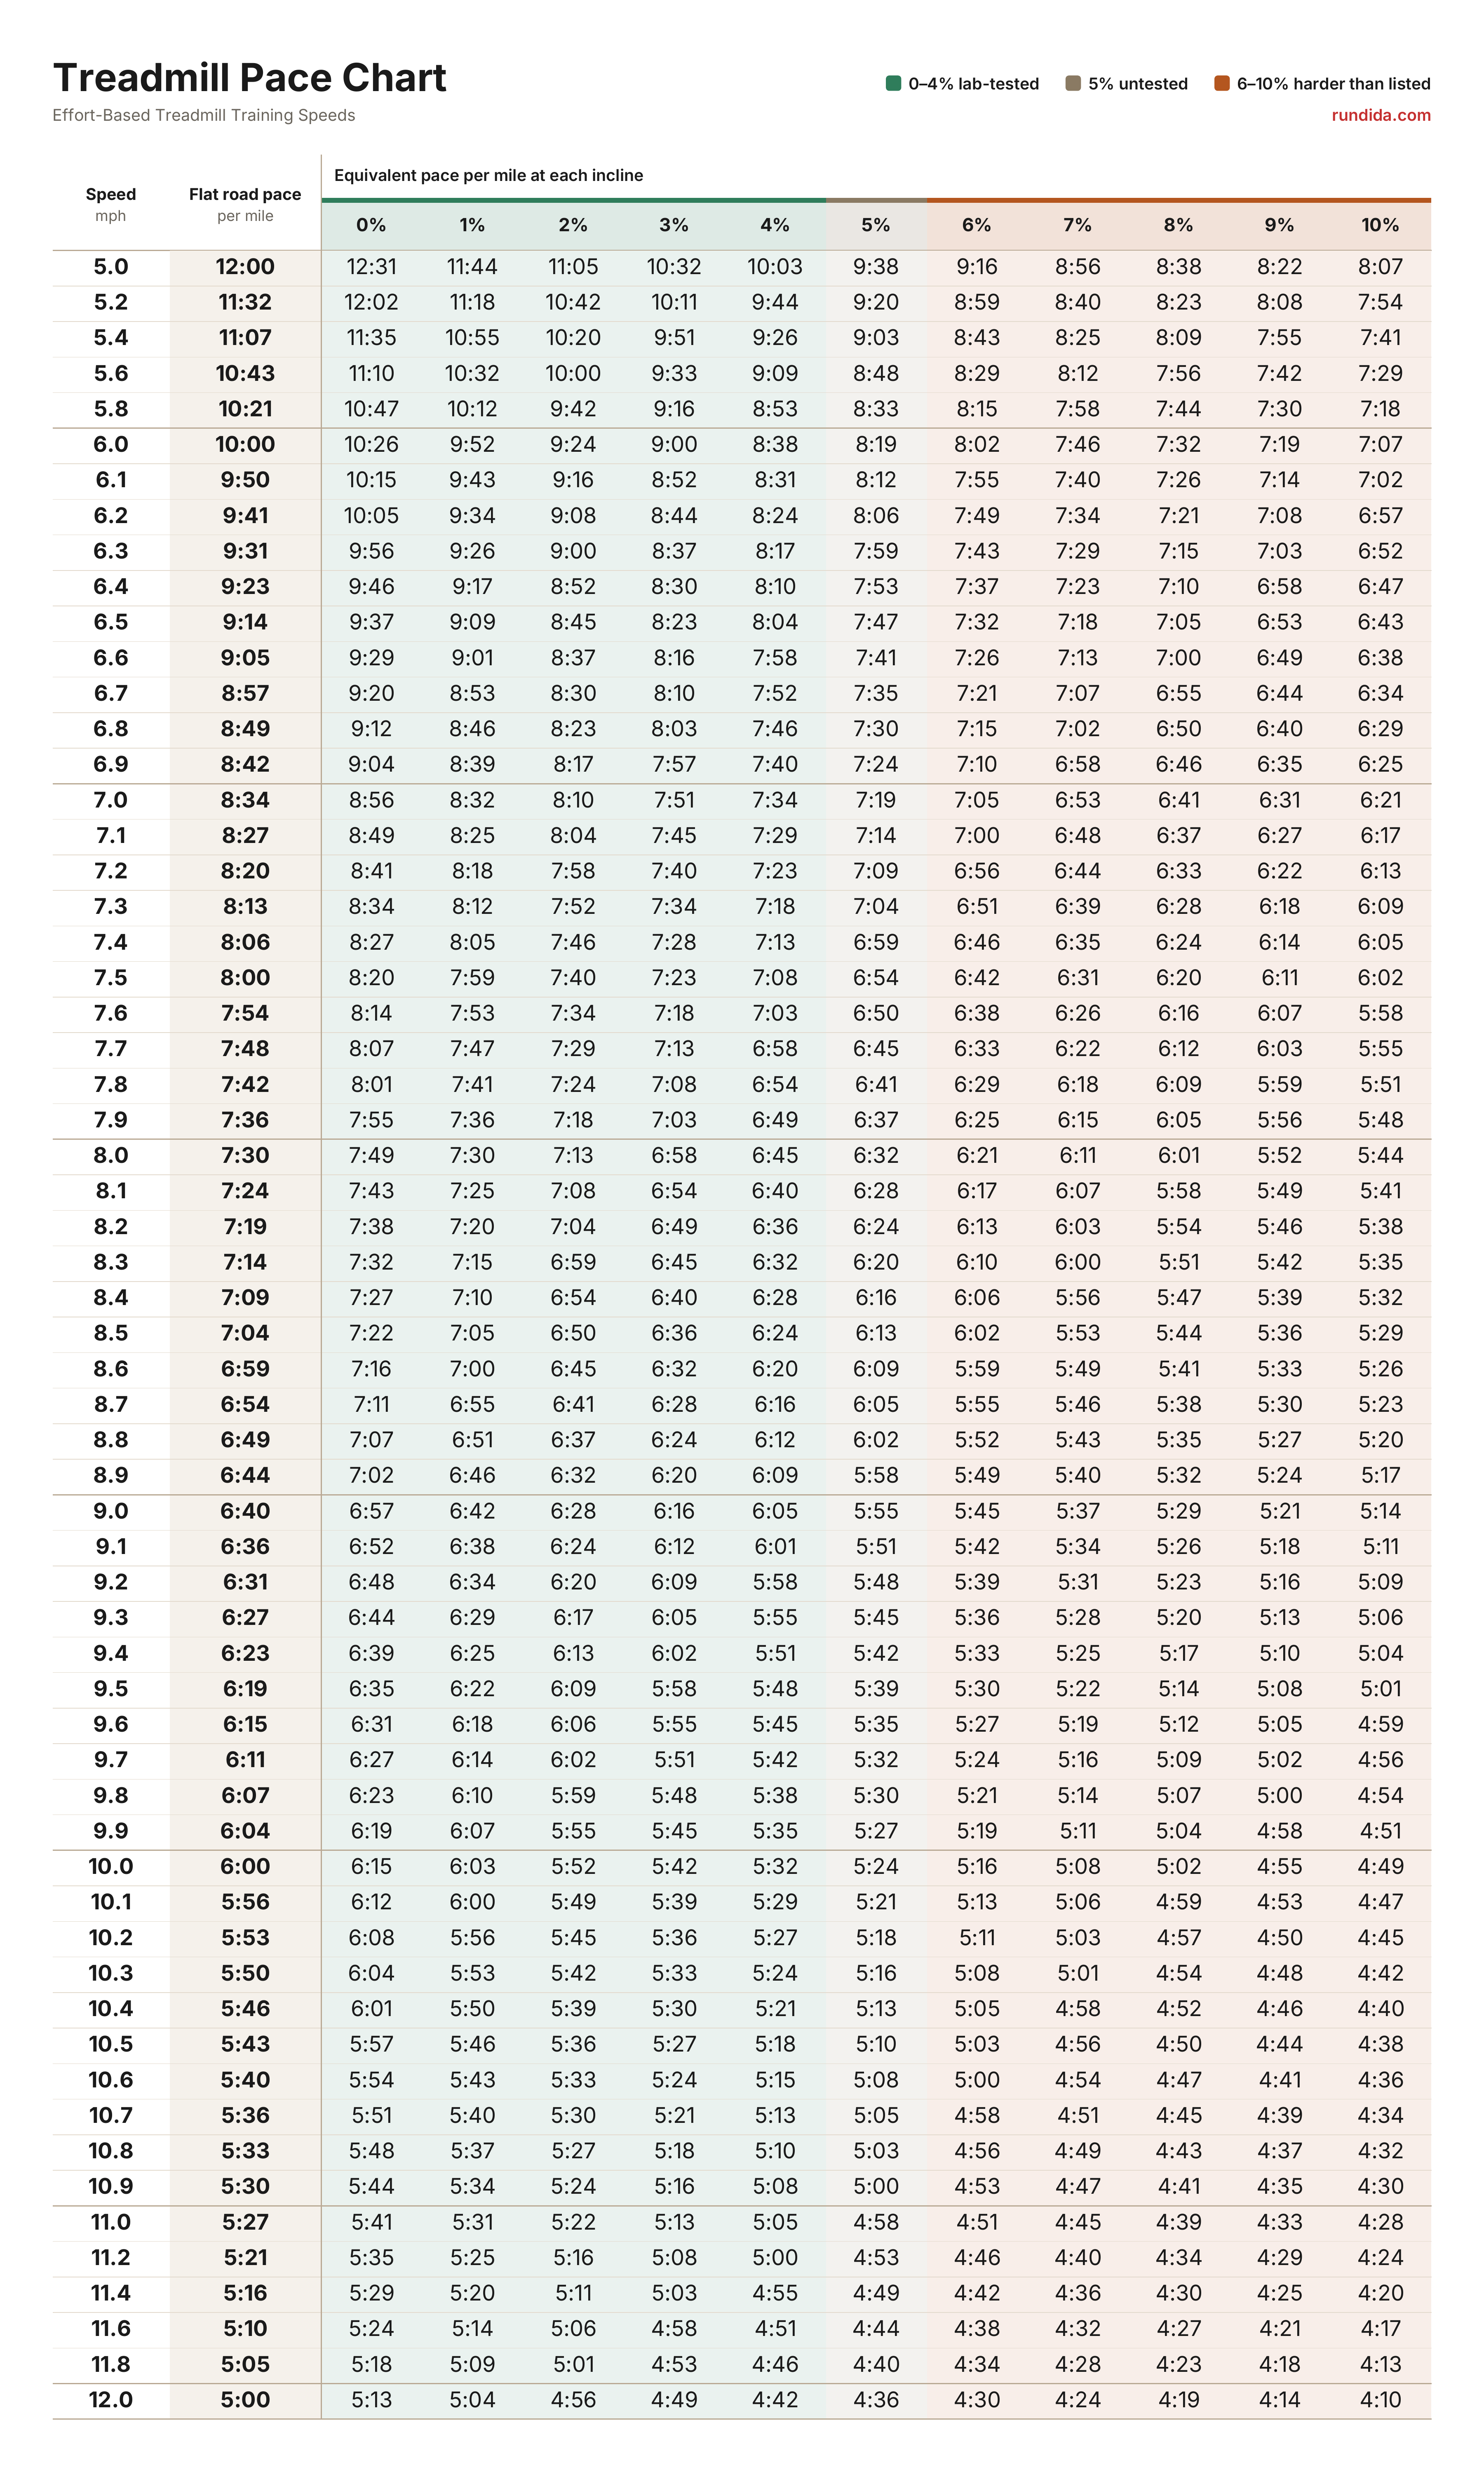
Treadmill pace chart, 5–12 mph: flat road pace per mile plus equivalent effort at 0–10% incline, marked where a 2022 lab test held up. Free printable PDF.

Tap any number to read it, or enter a target pace to find the treadmill speed.

Treadmill pace chart, minutes per mile Flat road pace 0–4%: held up in lab test 5%: not tested 6–10%: harder than listed 6–10%: in the full chart download Why?
Speedmph Flat road paceper mile Equivalent pace per mile at each incline
0%1%2%3%4%5%6%7%8%9%10%
5.0 12:00 12:3111:4411:0510:3210:039:389:168:568:388:228:07
5.2 11:32 12:0211:1810:4210:119:449:208:598:408:238:087:54
5.4 11:07 11:3510:5510:209:519:269:038:438:258:097:557:41
5.6 10:43 11:1010:3210:009:339:098:488:298:127:567:427:29
5.8 10:21 10:4710:129:429:168:538:338:157:587:447:307:18
6.0 10:00 10:269:529:249:008:388:198:027:467:327:197:07
6.1 9:50 10:159:439:168:528:318:127:557:407:267:147:02
6.2 9:41 10:059:349:088:448:248:067:497:347:217:086:57
6.3 9:31 9:569:269:008:378:177:597:437:297:157:036:52
6.4 9:23 9:469:178:528:308:107:537:377:237:106:586:47
6.5 9:14 9:379:098:458:238:047:477:327:187:056:536:43
6.6 9:05 9:299:018:378:167:587:417:267:137:006:496:38
6.7 8:57 9:208:538:308:107:527:357:217:076:556:446:34
6.8 8:49 9:128:468:238:037:467:307:157:026:506:406:29
6.9 8:42 9:048:398:177:577:407:247:106:586:466:356:25
7.0 8:34 8:568:328:107:517:347:197:056:536:416:316:21
7.1 8:27 8:498:258:047:457:297:147:006:486:376:276:17
7.2 8:20 8:418:187:587:407:237:096:566:446:336:226:13
7.3 8:13 8:348:127:527:347:187:046:516:396:286:186:09
7.4 8:06 8:278:057:467:287:136:596:466:356:246:146:05
7.5 8:00 8:207:597:407:237:086:546:426:316:206:116:02
7.6 7:54 8:147:537:347:187:036:506:386:266:166:075:58
7.7 7:48 8:077:477:297:136:586:456:336:226:126:035:55
7.8 7:42 8:017:417:247:086:546:416:296:186:095:595:51
7.9 7:36 7:557:367:187:036:496:376:256:156:055:565:48
8.0 7:30 7:497:307:136:586:456:326:216:116:015:525:44
8.1 7:24 7:437:257:086:546:406:286:176:075:585:495:41
8.2 7:19 7:387:207:046:496:366:246:136:035:545:465:38
8.3 7:14 7:327:156:596:456:326:206:106:005:515:425:35
8.4 7:09 7:277:106:546:406:286:166:065:565:475:395:32
8.5 7:04 7:227:056:506:366:246:136:025:535:445:365:29
8.6 6:59 7:167:006:456:326:206:095:595:495:415:335:26
8.7 6:54 7:116:556:416:286:166:055:555:465:385:305:23
8.8 6:49 7:076:516:376:246:126:025:525:435:355:275:20
8.9 6:44 7:026:466:326:206:095:585:495:405:325:245:17
9.0 6:40 6:576:426:286:166:055:555:455:375:295:215:14
9.1 6:36 6:526:386:246:126:015:515:425:345:265:185:11
9.2 6:31 6:486:346:206:095:585:485:395:315:235:165:09
9.3 6:27 6:446:296:176:055:555:455:365:285:205:135:06
9.4 6:23 6:396:256:136:025:515:425:335:255:175:105:04
9.5 6:19 6:356:226:095:585:485:395:305:225:145:085:01
9.6 6:15 6:316:186:065:555:455:355:275:195:125:054:59
9.7 6:11 6:276:146:025:515:425:325:245:165:095:024:56
9.8 6:07 6:236:105:595:485:385:305:215:145:075:004:54
9.9 6:04 6:196:075:555:455:355:275:195:115:044:584:51
10.0 6:00 6:156:035:525:425:325:245:165:085:024:554:49
10.1 5:56 6:126:005:495:395:295:215:135:064:594:534:47
10.2 5:53 6:085:565:455:365:275:185:115:034:574:504:45
10.3 5:50 6:045:535:425:335:245:165:085:014:544:484:42
10.4 5:46 6:015:505:395:305:215:135:054:584:524:464:40
10.5 5:43 5:575:465:365:275:185:105:034:564:504:444:38
10.6 5:40 5:545:435:335:245:155:085:004:544:474:414:36
10.7 5:36 5:515:405:305:215:135:054:584:514:454:394:34
10.8 5:33 5:485:375:275:185:105:034:564:494:434:374:32
10.9 5:30 5:445:345:245:165:085:004:534:474:414:354:30
11.0 5:27 5:415:315:225:135:054:584:514:454:394:334:28
11.2 5:21 5:355:255:165:085:004:534:464:404:344:294:24
11.4 5:16 5:295:205:115:034:554:494:424:364:304:254:20
11.6 5:10 5:245:145:064:584:514:444:384:324:274:214:17
11.8 5:05 5:185:095:014:534:464:404:344:284:234:184:13
12.0 5:00 5:135:044:564:494:424:364:304:244:194:144:10

Showing 0–5% on small screens. The 6–10% columns are in the full chart download. Values exactly as printed in 1996. Need a speed between rows? Use the treadmill pace calculator.

How to read the treadmill pace chart

Find your treadmill speed on the left. The bold Flat road pace column next to it is that speed converted to minutes per mile. Every column after that answers a different question: what would this effort be worth on a flat road?

One row, four answers: 6.0 mph

10:00Flat road pace

The speed itself, converted to pace. Pure arithmetic.

10:260% incline

The same run as a road effort. A flat belt counts as easier.

9:003% incline

Same belt speed, effort of a 9:00 road mile.

7:328% incline

Steep column: the lab test found these harder than listed.

  1. Speed to pace. 7.0 mph is 8:34 per mile. The Flat road pace column is plain arithmetic, not an estimate.
  2. Pace to speed. Pick your incline column, scan down to your usual road pace, then read the speed on the left. For an 8:00 effort at 3%, the chart lists 6.8 mph (8:03) and 6.9 mph (7:57). Choose one and adjust by feel, or type the pace into the finder above.
  3. Hills without more speed. At 6.0 mph, going from 0% to 3% moves the listed effort from 10:26 to 9:00 per mile. That is almost a minute and a half per mile harder without touching the speed button.

Treadmill shows kph? Multiply mph by 1.609 (6.0 mph is 9.7 kph), or use the pace and speed converter.

How to use the chart in your workouts

Start from the effort the workout calls for, pick an incline, then read the speed. Three common sessions, straight from the chart:

Easy run, gentle hill10:00 road effort at 2%5.6 mphListed at exactly 10:00. The incline adds training load while the belt stays slow.
Tempo run7:30 road effort at 1%8.0 mphListed at exactly 7:30. At 1% the speed barely changes from a flat road.
Hill repeats8:00 road effort at 4%6.6 mphListed at 7:58; 6.5 mph gives 8:04. 4% is the steepest grade the 2022 lab test confirmed.

Don’t know your road pace? Put a recent race time into the VDOT calculator to get your easy, marathon and threshold paces, then look those up here. With no race to go on, use the talk test: an easy run is a pace where you can still speak in full sentences.

Slower than 12:00 per mile? The chart starts at 5.0 mph, so run-walkers and incline walkers fall below it. Use the treadmill pace calculator for any speed, or the treadmill incline calculator for walking workouts.

Why the 0% column is slower than flat road pace

The chart treats a flat treadmill as easier than a flat road, by the same 4.3% at every speed. Each value in the 0% column is the Flat road pace slowed by exactly that much: 6.0 mph is 10:00 per mile, but the 0% column lists a 10:26 effort; 10.0 mph is 6:00 versus 6:15. The 1996 article puts the gap down to the air resistance you don’t push through indoors.
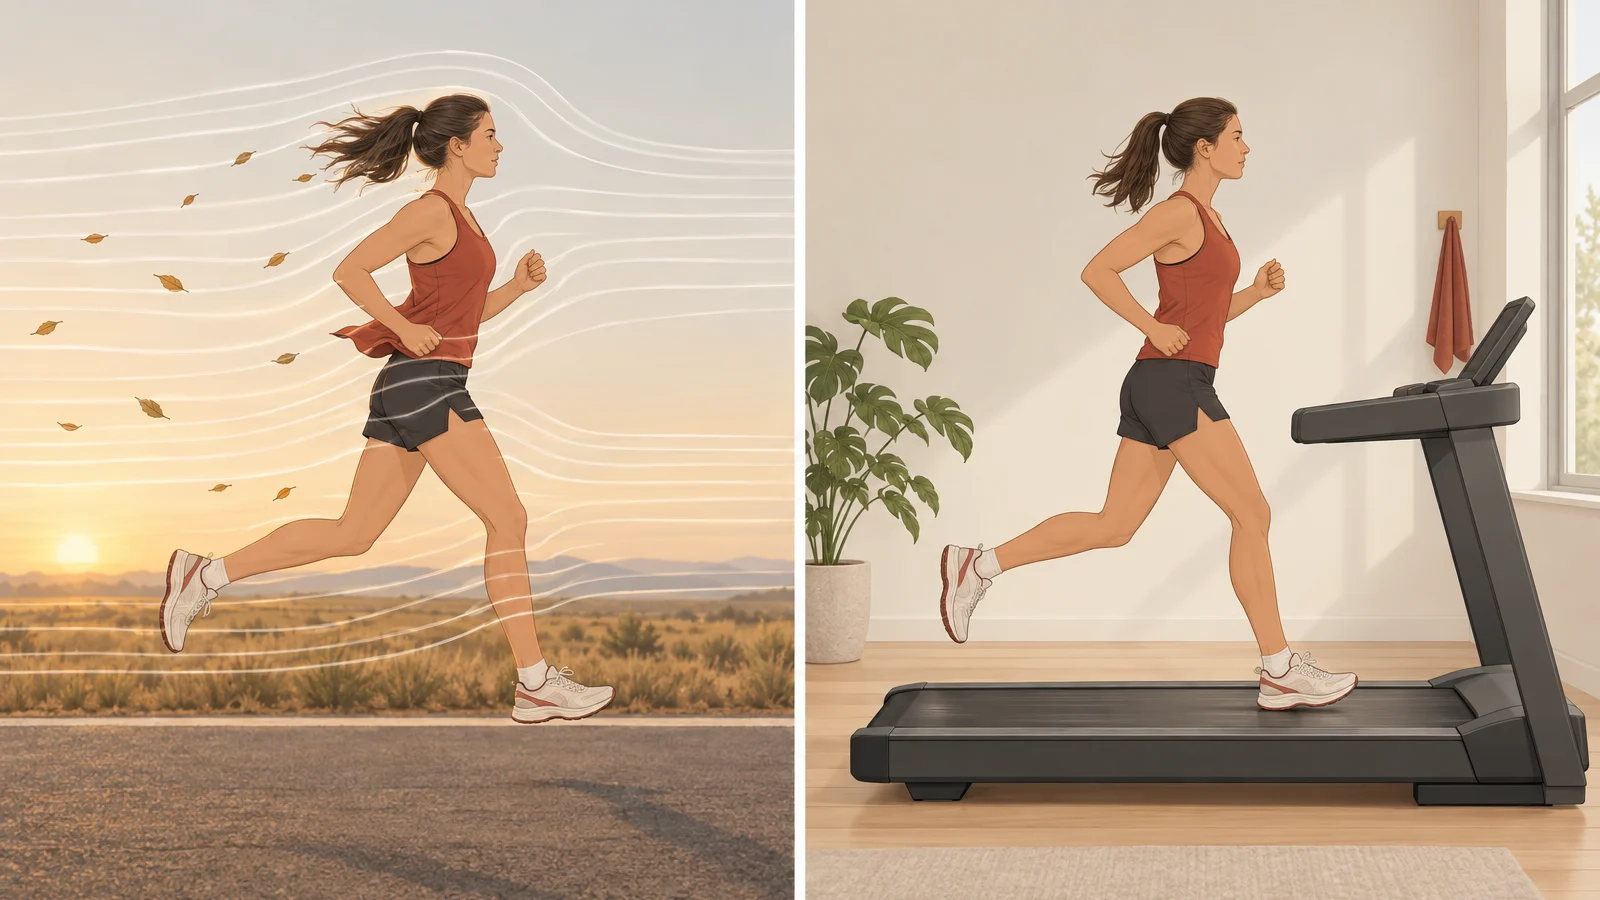
Runner on a road facing air resistance beside the same runner on a treadmill in still air
Outdoors you push through air; on a treadmill the belt moves and the air doesn’t. That is the gap the 0% column builds in.

That is why many runners default to 1%. In this chart, 1% lines up with the Flat road pace around 7.5 mph (8:00 against 7:59 listed). Slower than that, 1% counts as a little harder (5.0 mph: 12:00 vs 11:44). Faster, it counts as a little easier (12.0 mph: 5:00 vs 5:04).

The lab evidence for the 1% rule is narrower than its reputation. Jones and Doust (1996) found 1% best matched outdoor energy cost, but in nine trained men on short runs at about 6.5–11.2 mph.

How far to trust the incline columns

Up to 4%, the numbers held up in a lab test. From 6%, they understate how hard the incline is.

0–4%Use as listedIn the 2022 test, heart rate, oxygen use, lactate and perceived effort stayed level across these grades.
5%UntestedBetween the tested grades.
6–10%Treat as a ceilingOxygen use, heart rate, lactate and leg effort all rose. Slow down until the effort matches the session.

Foreman and colleagues (2022) ran 33 experienced runners through speed and incline combinations that this chart calls equal. From 0% to 4%, oxygen use, heart rate, blood lactate and perceived effort did not change, so the chart did its job. At 6% and above, tested only in the 22 faster runners, all of them rose: the “equivalent” setting was actually harder.

In practice: below 5%, set the speed from the chart. At 6% or more, treat the listed speed as an upper limit and slow down until your breathing or heart rate matches what the session calls for. An easy run should still feel easy.

Where the numbers come from

Every value on this page and in the downloads is copied from a 1996 newspaper table, including its uneven speed steps. Speeds go up by 0.2 mph below 6.0 and above 11.0, and by 0.1 mph in between. We have not smoothed, filled in or recalculated a single number.

Winter Treadmill Workouts, Guy Avery. National Masters News, February 1996, page 16.

  • Reprinted in the newspaper from Peak Running Performance.
  • The math is credited to James Orthmann and colleagues at Tennessee State University. The equation itself was never printed.
  • A version of the same chart circulates on HillRunner.com. That is the version the 2022 lab study tested.

The formula behind the chart, reconstructed

The original equation was never published, so we worked one out from the printed numbers. One line reproduces 637 of the 671 effort values to the exact second. The other 34 are one second off.

Reconstructed equation

u = 0.92 v² + 0.632 v G
pace (seconds per mile) = 3600 ÷ u
v
treadmill speed, mph
G
incline in percent (type 5 for 5%)
u
equivalent flat-road speed, mph
637/671printed values reproduced to the exact second (94.9%)
±1 slargest miss. 34 values are one second off, none by more.
61/610% values that are the flat road pace slowed by exactly 4.3%
0.25 saverage gap from the printed number

Every effort value, checked

Where the formula misses the printed table

0%1%2%3%4%5%6%7%8%9%10% 5 5.4 mph, 2%: 1 s5.4 mph, 7%: 1 s 5.6 mph, 1%: 1 s5.6 mph, 2%: 1 s 6.0 mph, 1%: 1 s 6 6.4 mph, 4%: 1 s 6.7 mph, 1%: 1 s 6.8 mph, 3%: 1 s6.8 mph, 6%: 1 s6.8 mph, 9%: -1 s 7 7.1 mph, 9%: -1 s 7.4 mph, 3%: 1 s 7.7 mph, 10%: -1 s 7.9 mph, 10%: -1 s 8 8.3 mph, 10%: -1 s 8.4 mph, 10%: -1 s 8.5 mph, 10%: -1 s 8.6 mph, 7%: 1 s8.6 mph, 10%: -1 s 8.7 mph, 10%: -1 s 8.9 mph, 2%: 1 s 9 9.2 mph, 2%: 1 s 9.4 mph, 10%: -1 s 9.5 mph, 9%: -1 s 9.6 mph, 5%: 1 s9.6 mph, 10%: -1 s 9.7 mph, 5%: 1 s 9.9 mph, 9%: -1 s 10 10.2 mph, 10%: -1 s 10.6 mph, 4%: 1 s 11 11.2 mph, 6%: 1 s 11.4 mph, 4%: 1 s 11.6 mph, 10%: -1 s 12.0 mph, 10%: -1 s 12 mph
Exact to the second Formula 1 s slower Formula 1 s faster

What it reveals: the chart’s incline bonus is built to fade as you speed up. At 10%, 6 mph counts as running 46% faster than the 0% column. At 12 mph, the same incline is worth only 25%. Neither physiology model below works that way.

What it doesn’t prove: the formula copies the table; it doesn’t test it on runners. We fitted it to these numbers, so a close match is expected. It is our reconstruction, not Orthmann’s equation, and it does not generate any value in the chart.

How the chart compares with modern models

At 2%, the chart and two physiology models agree within about 12 seconds per mile at 6–8 mph. At steep grades and faster speeds they split apart: at 10 mph and 8%, the chart says 5:02, the ACSM equation 4:36 and Minetti’s model 4:08.

Incline bonus by speed: 1996 chart vs two physiology models

+0% +10% +20% +30% +40% +50% +60% +70% 0%2%4%6%8%10% Treadmill incline
Equivalent pace per mile at 8.0 mph
Incline1996 chartACSMMinetti
0%7:497:497:49
2%7:137:107:01
4%6:456:376:19
6%6:216:095:43
8%6:015:455:11
10%5:445:234:43

All three start from the chart’s own 0% value, so only the incline effect differs. These are model outputs, not measured outdoor paces.

Read each line as “how much faster than flat does this incline count”. The ACSM running equation adds the same 4.5% for every 1% of grade, at any speed. Minetti’s 2002 energy-cost model adds more, and more again on steep grades. The 1996 chart starts close to both, then flattens as speed rises.

The 2022 lab result points the same way on steep grades: runners worked harder at 6% and above than the chart predicted. So we keep the 671 printed values and flag the steep columns, instead of quietly replacing them with a model’s output.

Frequently Asked Questions

What pace is 6 mph on a treadmill?

6 mph is 10:00 per mile, or about 6:13 per kilometre. That is the chart’s Flat road pace. Its 0% column lists 10:26 for the same speed: an estimate of the equivalent effort, not a different speed.

What incline makes a treadmill like running outside?

1% is the usual answer, from a 1996 study of nine trained men running at about 6.5–11.2 mph. In this chart, 1% matches the Flat road pace closely around 7.5 mph, counts as slightly harder at slower speeds and slightly easier at faster ones. Treat it as a starting point, not a rule for every runner or machine.

Why does the 0% column differ from the Flat road pace column?

The chart treats a flat belt as about 4.3% easier than a flat road at every speed, and the original article blames the missing air resistance indoors. So 0% always lists a slower road-equivalent pace than the belt shows, for example 10:26 against 10:00 at 6.0 mph.

Are the incline numbers accurate?

Up to 4%, yes for the runners tested: a 2022 study of 33 experienced runners found no change in oxygen use, heart rate, lactate or perceived effort across these grades. At 6% and above, the supposedly equal settings were harder. Use those columns as an upper limit and go by effort.

Can I use the chart on a treadmill that shows kph?

Yes. Convert the speed with kph = mph × 1.609: 6.0 mph is about 9.7 kph (km/h) and 8.0 mph about 12.9 kph. The chart stays in its original mph and minutes per mile. For other unit pairs, use the pace and speed converter.

Can I print the treadmill pace chart?

Yes. Download the one-page PDF with the whole chart, an A4 or US Letter version split over two pages with repeated headings, or a PNG sized for a phone screen. All formats carry the same 61 speeds and 11 inclines as the web chart.

References 4 sources
  1. Guy Avery (1996). Winter Treadmill Workouts. National Masters News, February, p. 16; reprinted from Peak Running Performance. References
  2. Foreman, N. A., Lee, E. J., & Lundstrom, C. J. (2022). Assessment of a Treadmill Speed Incline Conversion Chart: A Validation Study. International Journal of Sports Physiology and Performance. doi:10.1123/ijspp.2021-0021
  3. Jones, A. M. & Doust, J. H. (1996). A 1% treadmill grade most accurately reflects the energetic cost of outdoor running. Journal of Sports Sciences. doi:10.1080/02640419608727717
  4. Minetti, A. E. et al. (2002). Energy cost of walking and running at extreme uphill and downhill slopes. Journal of Applied Physiology. doi:10.1152/japplphysiol.01177.2001