
Average Marathon Time by Age & Gender — Is Yours Good?
Median marathon finish: men 4:14, women 4:41, overall 4:25:33 across 430,000 real US finishers. Plus what counts as a good time for your age & gender.
Key Takeaways
- The global average marathon time is around 4:34 — and it has been getting faster, not slower, since 2019.
- Peak performance happens around age 30-34 for women and 35-39 for men, based on analyses of hundreds of thousands of finishers.
- Middle-age decline is gradual, not a cliff — many runners still race at roughly 90% of their peak speed in their late 50s.
- Age-graded scoring is the fairest way to compare across ages — it adjusts for the physiological reality of aging.
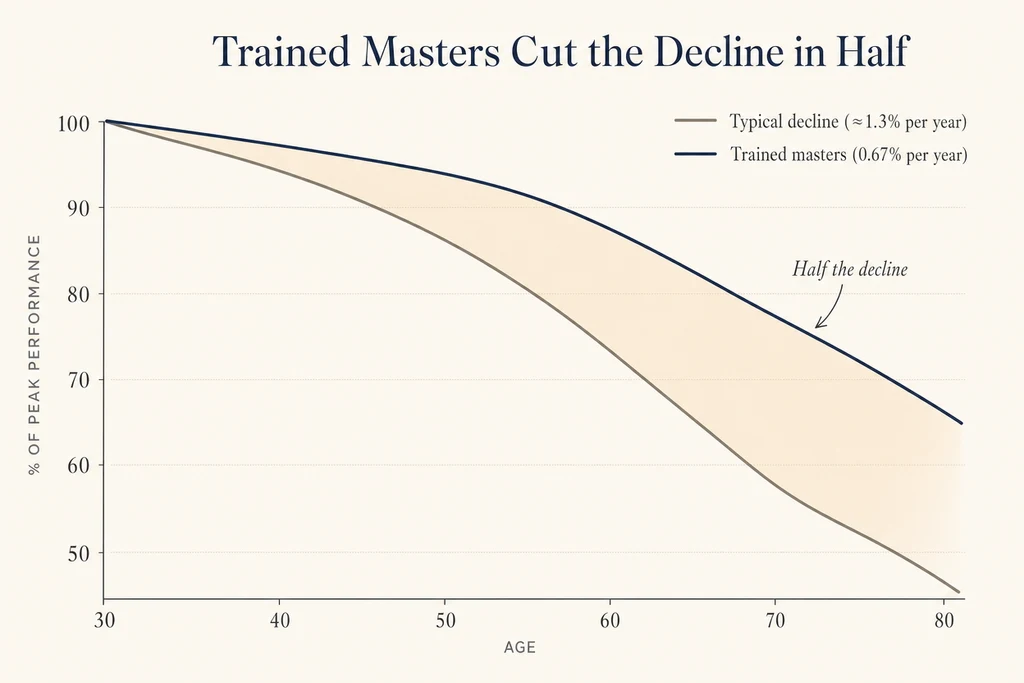
- Trained masters cut the typical decline roughly in half through consistent volume, strength work, and longer recovery cycles.
What's the Average Marathon Finish Time?
The average US marathon finish in 2024 was 4 hours 34 minutes (RunRepeat's 2025 State of US Marathons report) — but that headline hides huge variation: a 30-year-old man's average is 4:02, a 60-year-old's is over 5:00, and women average ~28 minutes slower than men across age groups. The median US finish time was 4:25:33 across some 430,000 finishers at 251 US marathons, with median splits of 4:14 (men) and 4:41 (women) (Brian Rock's 2024 median analysis). London 2024, one of the world's biggest fields, reported an overall average of 4:28 (men 4:11; women 4:49).
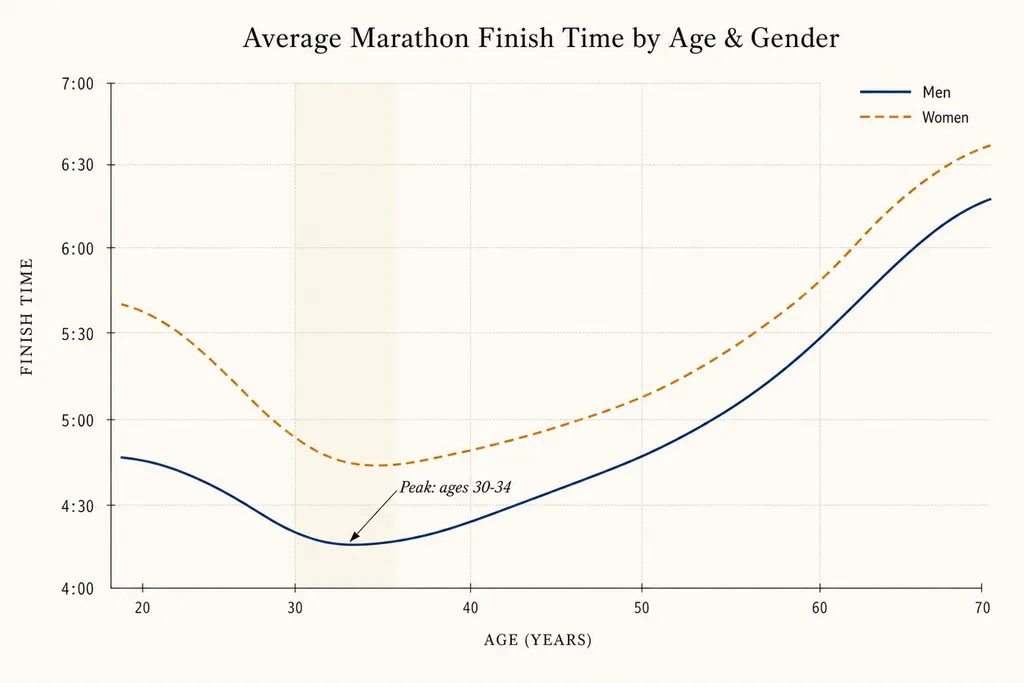
One number doesn't tell the full story, though. Marathon performance varies dramatically by age, gender, training background and the course itself. A 4-hour finish at 60 is physiologically more impressive than a 4-hour finish at 30. To know where you stand, you need to look at the data through your own demographics. For a quick estimate of your own potential, the Finish Time Calculator projects a marathon time from a recent shorter race.
Marathon Times by Age and Gender
Here are representative averages across age groups, synthesised from US and London Marathon finishers (2022-2024):
| Age | Men | Women |
|---|---|---|
| 18-24 | 4:15 | 4:45 |
| 25-29 | 4:07 | 4:36 |
| 30-34 | 4:02 | 4:31 |
| 35-39 | 4:06 | 4:36 |
| 40-44 | 4:11 | 4:46 |
| 45-49 | 4:21 | 4:55 |
| 50-54 | 4:31 | 5:06 |
| 55-59 | 4:45 | 5:20 |
| 60-64 | 5:02 | 5:42 |
| 65-69 | 5:23 | 6:02 |
| 70+ | 5:51 | 6:33 |
Two things to notice. First, the fastest age group isn't the youngest — runners in their late 20s and early 30s combine youthful physiology with years of training. Second, the slowdown is gentle through your 40s and 50s and steepens after 60.
The Gender Gap, and What Changes at 50
Across all age groups, men finish marathons about 6% faster than women on average in recent recreational populations. In the 2022 St. George Marathon analysed by Merrill and Hunter, men averaged 4:17:03 and women 4:32:45 — a 15:42 raw gap, narrowing to 3:50 after adjusting for age. Most of that comes from physiology: higher VO2max, more muscle mass, higher hemoglobin concentration. But women systematically beat men on one variable.
That pacing edge is real and consistent. Men are much more likely to start too fast and slow dramatically after 30 km — especially in the 18-29 group. If you keep hitting the wall after kilometre 30, a more conservative early pace is usually the fix.
The gap narrows with age too. Among finishers 60 and over, the men-women time difference shrinks to roughly 20-25 minutes (~8-9%) — partly because women who keep racing into their 60s tend to be more competitively committed, partly because men decline more steeply at the top end.

Menopause and marathon performance
One thing missing from most marathon-by-age guides — but central in the running communities of women in their 40s and 50s — is menopause. The perimenopause-to-postmenopause transition brings challenges that don't show up cleanly in VO2max or HRmax decline curves: estrogen drop affects iron handling, sleep quality and connective-tissue elasticity, all of which influence both training adaptation and injury risk.
Many women report a PR window in their late 40s followed by a more rapid drop than the population age curve predicts. The pragmatic response: lean further into easy mileage, prioritise two or three strength sessions a week, and watch sleep and iron status closely. This is an active research area, and published data on female-specific marathon trajectories across menopause is still limited compared with the male literature.
Who Runs a Marathon Today?
"What's the average age of a marathon runner?" is a different question from "what's the average time?". The answer surprises most people: the median US marathon finisher is in their late 30s, not their 20s. Masters runners — age 40 and over — now make up roughly half of major US fields, a share that has grown steadily over three decades.
Knechtle's long-horizon Berlin Marathon analysis (1974-2019) shows the same pattern: masters participation has risen sharply while average masters times have edged slower. Both trends point to the same cause — the sport has become more accessible to first-timers and casual runners, not less rigorous for trained ones.
Two takeaways for your own benchmarking. First, compare to "average for your age and experience," not the headline overall average — the 4:34 global figure contains everyone from first-time charity runners to serious competitors. Second, your Strava percentile is not your real-world percentile. Strava's 2024 Year in Sport reported a median marathon pace of ~10:15/mile, with 44% of marathon runners wearing carbon-plated "super shoes." Strava skews younger, more gear-aware and more performance-focused than the general marathon population.
Why Times Decline With Age — and How Some Runners Defy It
Three things drive the age-related slowdown: VO2max declines roughly 7-10% per decade after 35, maximum heart rate drifts down about 1 bpm per year (Tanaka, Monahan and Seals' revised formula: HRmax ≈ 208 − 0.7 × age), and recovery capacity drops — the older you get, the longer you need between hard sessions. Add sarcopenia from your 40s onward, and the curve in the table earlier explains itself.
But the curve is not a cliff. Berlin Marathon data shows runners in their late 50s still race at roughly 90% of their peak speed. And the most striking finding in modern marathon research is just how much that decline can be flattened.
Three habits separated those athletes from typical aging runners. They kept weekly mileage year-round rather than only during race build-ups (50-80 km/week, dialed down gradually with age). They did strength training two or three times a week to preserve muscle and running economy. And they stretched their recovery — quality workouts every 3-4 days instead of every 2.
The elite-frontier picture is even more striking. Lepers and Cattagni (2012) found the best female marathoners over 45 and the best male marathoners over 65 actually improved over the past three decades. The masters ceiling keeps rising.
Where Do You Stand? Age-Graded Performance
Raw finish times are a crude benchmark. A 58-year-old running 3:45 is doing something more impressive than a 28-year-old running the same time — but on a simple ranking they look identical.
Age grading fixes that. It expresses your time as a percentage of the world-record time for your age and gender. A score of 60% means you ran at 60% of the estimated world-best for your demographic. The conventional buckets used by US and UK masters clubs:
- Above 90%: world-class
- 80-90%: national-class
- 70-80%: regional-class
- 60-70%: local competitive
- Below 60%: recreational
Use the Age Grading Calculator to convert any race result into your age-graded percentage. It's the most useful single number for tracking improvement over the years — you compete against your own physiological potential, not against your 25-year-old self.
Boston Qualifier and London Good For Age: 2026 Standards
Two qualifying standards dominate the global marathon calendar: Boston's BQ and London's Good For Age (GFA). Both roughly mark the top 10-15% of finishers in each age bracket. Both tightened for the 2026 cycle.
Boston: 5 minutes faster for 18-59
Effective September 2024, the BAA tightened qualifying times by 5 minutes across every age bracket from 18 to 59. Some highlights for the 2026 cycle:
- Men 18-34: 2:55:00 (was 3:00:00)
- Men 40-44: 3:05:00
- Women 18-34: 3:25:00
- Women 45-49: 3:45:00
Meeting the standard isn't always enough — the 2026 cycle required runners to finish about 4 minutes 34 seconds under the published time to actually get in. Boston fills the field fastest-under-standard first.
London: tightened, and "fastest first"
For 2026 London tightened too — men 18-39 to sub-2:52, women 18-39 to sub-3:38. Unlike Boston, London allocates 6,000 GFA places strictly fastest-first. Meeting the published time is essentially the threshold, and runners usually need a meaningful margin under to actually get an entry.

For the full BQ time chart and every age bracket, use the Boston Qualifying Calculator or read the Boston Qualifying Guide.
How to Improve at Any Age
The right approach depends less on your age decade than on your experience. Four common starting points:
First-timer or returning after a long break. Goal: finish, not rank. Time comes with your second and third marathons. The biggest lever is building consistent weekly mileage gradually over 4-6 months. Start with the Beginner Running Guide.
Experienced and under 35. You have headroom. Keep building weekly mileage (the single strongest predictor of marathon performance) and add structured speed work — tempo runs at threshold pace and intervals targeting VO2max.
Experienced, 35-50. Consistency over intensity. Two quality sessions a week — one tempo, one long run with marathon-pace segments — is plenty. Add strength training twice weekly. Leave 48 hours between hard efforts.
Experienced, over 50. Shift toward more easy running (85-90% of volume) with fewer but more purposeful hard sessions. Extend the taper to 3 weeks. Focus on running economy through short strides and cadence work. For women, pay extra attention to nutrition (iron, calcium), sleep and hip-stabiliser strength work.
At every age, the most common mistake is comparing yourself to the wrong benchmark — your 25-year-old self, your training partner, an arbitrary round-number goal. None of those is as useful as your age-graded percentage. To dial in your training zones from there, the Training Pace Calculator is the next step.
Sources & References
- (2026). Differences in Marathon Times and Pacing Between Men and Women Based on Age, Distance, and Place Order. Perceptual and Motor Skills.
- (2019). The Age-Related Performance Decline in Marathon Running: The Paradigm of the Berlin Marathon. International Journal of Environmental Research and Public Health.
- (2021). Increased Participation and Decreased Performance in Recreational Master Athletes in 'Berlin Marathon' 1974-2019. Frontiers in Physiology.
- (2012). Do older athletes reach limits in their performance during marathon running?. Age (Springer/GeroScience).
- (2021). Sub 3-Hour Marathon Runners for Five Consecutive Decades Demonstrate a Reduced Age-Related Decline in Performance. Frontiers in Physiology.
- (2014). Relationship between age and elite marathon race time in world single age records from 5 to 93 years. BMC Sports Science, Medicine and Rehabilitation.
- (2001). Age-predicted maximal heart rate revisited. Journal of the American College of Cardiology.
- (2025). The State of US Marathons 2025. Industry report.
- (2024). 2024 London Marathon Official Stats. Race official statistics.
- (2024). 2026 and 2027 Registration Updates — Boston Marathon Qualifying Standards. Official race standards.
- (2025). London Marathon Good For Age Standards 2026. Official race standards.
- (2023). WMA Age-Grading Factors and Standards, 2023 Revision. Official masters athletics standards.
- (2024). Year in Sport 2024 — The Trend Report. Industry report.