HRV for Runners: Read Your Number Without an Age Chart
One HRV reading is mostly noise. How to build a normal range from your own nights, why devices disagree, and what HRV training really buys.
Key Takeaways
- One night is mostly noise — the clearest reproducibility figure, from short resting recordings, is about 0.5 to 0.6: read a run of nights, not one morning.
- Your own band beats any age chart — published tables come from 24-hour or 10-second ECG recordings, and your watch's overnight reading matches none of them.
- HRV-guided training saves effort, not seconds — pooled trials moved recovery HRV but not VO2max or endurance; the one trial that counted found fewer hard sessions.
- A rising number is not automatically good — in trained triathletes pushed into overreaching, weekly HRV climbed while their running test performance fell 9.0%.
- Never mix devices — Apple reports SDNN, most others RMSSD, and no valid conversion exists; a new watch, app or wear position means starting your series over.
A single HRV reading tells you less than the colour on your app suggests. It moves with your sleep, last night's beer and the sensor's own noise, and against someone else's number it means nothing at all. What is worth reading is the gap between last night and your own ordinary nights. This page is the reading; the HRV calculator does the arithmetic.
Start with what one night can actually tell you
Begin with how far one reading wanders on its own. In a study of 417 young healthy Japanese men, day-to-day reproducibility of most short resting HRV indices came out at only about 0.5 to 0.6, where 1 would be perfect. That is a few quiet minutes seated, not a whole night, but it is the clearest figure we could find on HRV's own drift.
A second study compared the two sampling rates. In 21 trained male triathletes, weekly sampling detected nothing; only the average of daily recordings caught what the training block had done. Isolated, once-per-week recordings, the authors wrote, may not detect training-induced autonomic modulations.
The unit that carries meaning is a run of nights against your own usual range — the comparison the calculator builds.
Evidence detail: what those two studies actually measured
The reproducibility figure comes from 417 young healthy Japanese men (Kobayashi et al. 2012). The recordings were short and seated, so that intraclass correlation of approximately 0.5 to 0.6 describes the repeatability of short resting measurement, not of the overnight readings a watch produces. The same study found the time-domain measures to be right-skewed, which is why baselines are built in log space rather than on the raw numbers.
The weekly-versus-daily comparison comes from a randomised study of 21 trained male triathletes (Le Meur et al. 2013). The population is trained triathletes rather than recreational runners, and the recordings were deliberate daily measurements rather than wearable output.
Build the only normal range that applies to you
Every "normal HRV by age" chart you are likely to meet was built under one recording condition, and your watch uses none of them. The 24-hour and 10-second ECG recordings behind those charts do not even agree on whether men and women differ. The review they lean on states it plainly: 24-hour, short-term and ultra-short-term normative values are not interchangeable. The calculator page takes that apart further.
Your own history has no such problem. Three steps:
- Collect 5 to 30 nights from one device and one metric. Fourteen is far steadier than five.
- Convert them to logs. HRV values bunch low and trail high, so a plain average describes them badly.
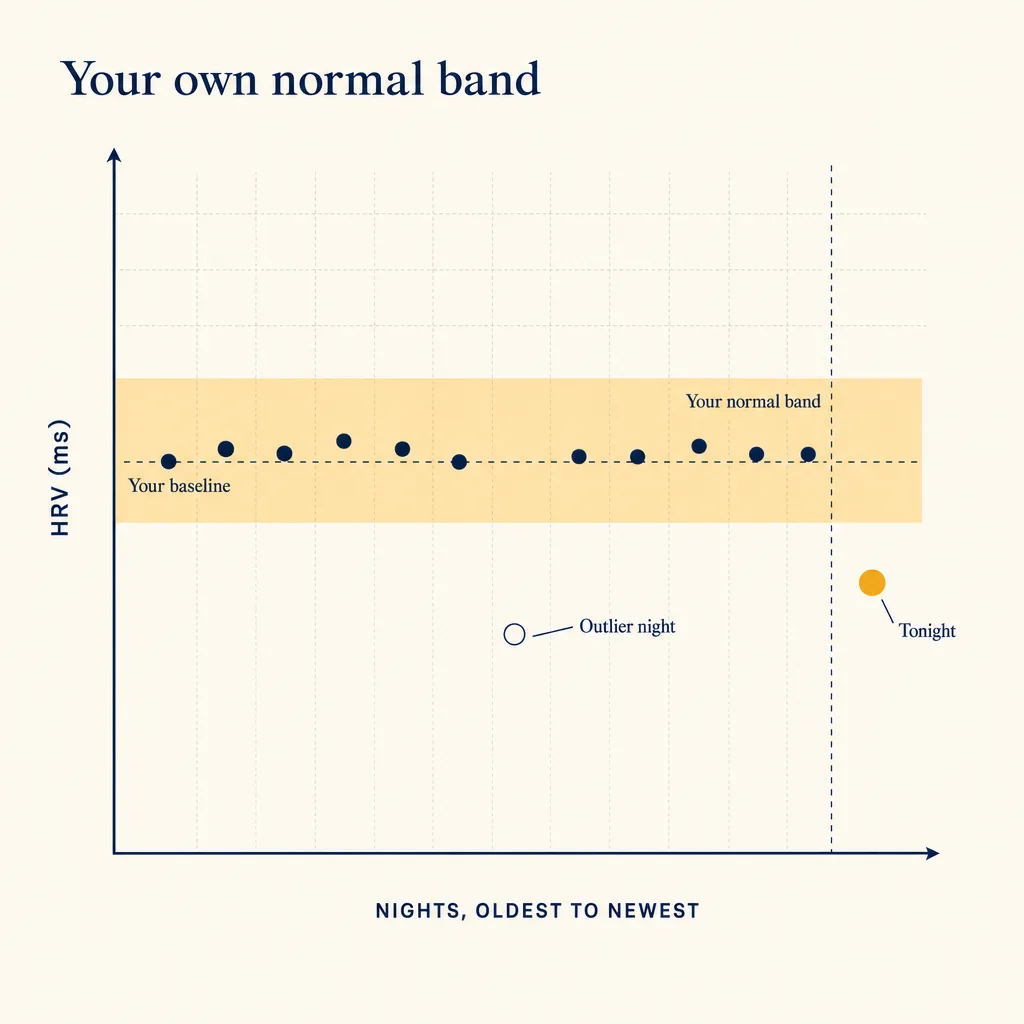
- Mark one standard deviation either side of the middle. That band is where your ordinary nights land.
Nor is this homemade: the two HRV-guided trials described below both defined normal against each participant's own history, not a population value.
Evidence detail: where the personal-band idea comes from
In the 40-runner trial the rule was written into the method verbatim: "The MOD/HIT session was programmed if HRV was within an individually determined smallest worthwhile change" (Vesterinen et al. 2016). In the earlier trial of 26 moderately fit men, the trigger was a value below the reference — a 10-day mean minus one standard deviation — or a decreasing trend for two days, either of which sent the participant to low intensity or rest (Kiviniemi et al. 2007).
The width of the band is a convention rather than a research finding. One standard deviation either side of your own mean is wide enough that ordinary nights sit inside it and narrow enough that a real change shows up.
Know what one bad night does to your average
A late race, a stomach bug or three glasses of wine does not spoil one number: in a plain seven-day average it drags every reading behind it for a week. There is no button for it on WHOOP. A staff member wrote in the official WHOOP community in February 2026 that individual nights cannot yet be excluded from HRV baseline calculations; a second staff reply said the baseline should settle within two to three weeks, depending on the person.
So do not delete it on the device: you lose a night of history and the baseline behaves the same anyway. Treat the days straight after a bad night as unreadable. The calculator flags outlier nights and counts down how long each has left.
Smoothing has a cost. Rolling two-to-four-day averages estimated mean changes more precisely in 37 well-trained athletes during strength and interval overload blocks, but the same paper warned they have the potential to be detrimental for classification of individual short-term responses. If poor nights stack up, sleep is the more useful fix.
See why your number and your friend's don't match
Two runners comparing HRV are usually comparing different statistics over different slices of the night. Apple Health reports SDNN, the overall spread of your beat-to-beat intervals; Garmin, Polar and WHOOP report RMSSD, how much each beat differs from the next, and Oura's documentation has named rMSSD as well. Even among those four the window differs: Garmin averages the whole sleep period, Polar roughly the first four hours, WHOOP weights the night toward slow-wave sleep and the later hours without publishing the weights.
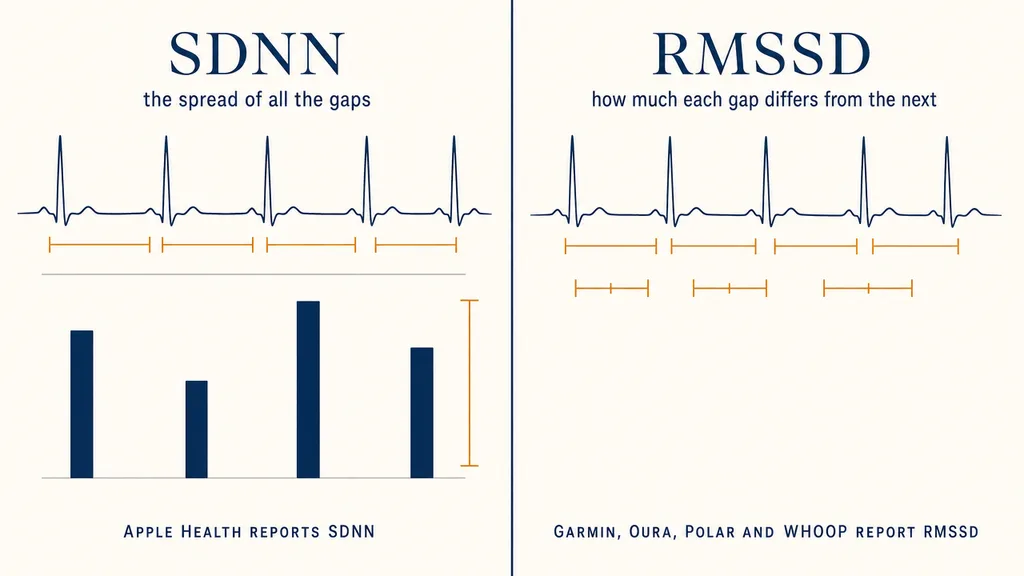
Garmin says as much itself: differences in the timing and duration of measurement make apples-to-apple comparisons between devices a challenge. There is no valid conversion between SDNN and RMSSD. What each brand measures is tabulated on the calculator page, with device-by-device detail in the WHOOP guide and the Garmin readiness guide.
One limit applies to all of them. Overnight, in recreational endurance athletes, wrist readings tracked a chest-strap reference sensor closely but ran systematically high, and the gap seemed largest in people whose HRV is low. In free-living conditions — days and nights alike — a consumer wrist sensor was judged a poor surrogate for HRV in a small study, because such sensors read pulse rate variability: your wrist pulse, not your heartbeat. Nights came out better than days there, and the overnight comparison above is the one where wrist readings held up, so build your series from nights rather than daytime spot checks.
Three mistakes runners make with their HRV
Comparing with someone else's number. Different brands report different statistics, and no chart can say which of you is fresher.
Reading an Apple number against RMSSD advice. Apple Health reports SDNN, the label on your screen just says HRV, and the published RMSSD ranges describe a different statistic. Keep an Apple series Apple.
Moving a session on one morning's reading. Wait until a run of nights agrees, and keep easy days easy by heart rate zone instead.
Ask what HRV-guided training actually buys you
It buys something real, but not what the marketing implies. Pooled across the trials, the only thing that clearly improved was HRV itself — the measures tracking the rest-and-recover branch of your nervous system. If HRV-guided training is superior, that analysis concluded, current data suggest it is only by a small margin, with less likelihood of negative responses.
| The trial | What HRV guidance changed | What it did not change |
|---|---|---|
| Pooled analysis of HRV-guided trials (Manresa-Rocamora et al. 2021) | Rest-and-recover HRV, pooled effect 0.50 | VO2max, ventilatory threshold, endurance performance — all non-significant |
| 40 recreational endurance runners (Vesterinen et al. 2016) | 13.2 hard sessions against the other group's 17.7; its own 3,000 m improved 2.1% | The gap between groups was small; VO2max rose more in the traditional group (5.0% against 3.7%) |
| 26 moderately fit men, randomised (Kiviniemi et al. 2007) | Maximum treadmill load rose further, 0.9 against 0.5 km/h | No significant VO2peak difference between groups |
The pattern holds: similar fitness on fewer hard sessions, with less chance of a bad response. Worth having, if your hard days are limited. It is not a faster 10K — for a runner who takes twelve minutes over 3,000 m, one percentage point is about seven seconds, which is roughly the whole gap between the two groups. What decides today's hard session is your training load, not last night's number.
Evidence detail: the numbers behind the table
In the pooled analysis, the rest-and-recover HRV measures came out at SMD+ 0.50 (95% CI 0.09 to 0.91). VO2max was 0.20 (−0.07 to 0.47), the second ventilatory threshold 0.26 (−0.05 to 0.57) and endurance performance 0.20 (−0.09 to 0.48), all non-significant (p > 0.05).
In the 40-runner trial, the HRV group averaged 13.2 ± 6.0 high-intensity sessions against 17.7 ± 2.5 in the traditional group (P = 0.021). Over 3,000 m the HRV group improved 2.1% ± 2.0% (P = 0.004) while the traditional group's 1.1% ± 2.7% did not reach significance, with a small effect size of 0.42 between them. Both groups raised VO2max, the traditional group by more (5.0% against 3.7%) — which is why "the HRV group did better on everything" is not a reading this trial supports.
Watch for the times a rising number is bad news
The assumption that up is good breaks where you most want a warning. In one study, 21 trained male triathletes were randomly assigned to two groups. The group driven into functional overreaching — the over-tired stage where performance dips but still recovers with rest — lost 9.0% ± 2.1% on a maximal running test while their weekly average HRV climbed gradually. That is a trained-triathlete population, but it is enough to stop treating higher as better.
Two smaller reversals. In elite athletes, HRV has been reported to fall even as resting heart rate falls — researchers call it saturation, and whether recreational runners see it has not been established. Many runners also see HRV sag during a taper, when sleep, routine and nerves change at once; they call it the taper tantrum. The most upvoted answer in an r/ultrarunning thread on that worry opens: "Before a race ignore it."
Which is why the number needs checking against what you can feel. In one study of elite footballers, morning ratings of fatigue, sleep quality and soreness tracked day-to-day training load more sensitively than heart-rate-derived indices did. That is a different sport on a different timescale, but a good reason to answer that question honestly.
The pattern that earns attention is a falling HRV alongside a resting heart rate several beats above normal. Coaches and runner communities read three to five days of that as ordinary adaptation and a fortnight or more as a problem — rules of thumb, not clinical thresholds. The overtraining guide covers the signs that carry more weight, and a recovery plan with honest sleep accounting does more than any morning number.
Evidence detail: what the overreaching and football studies covered
In the overreaching study (Le Meur et al. 2013), the rise in weekly Ln RMSSD was gradual rather than a spike, and the 9.0% ± 2.1% drop was measured on a maximal incremental running test. Twenty-one trained male triathletes were randomly assigned, and the finding concerns functional overreaching in that group.
The saturation pattern — reductions in HRV despite decreases in resting heart rate — was described in a review of elite endurance athletes (Plews et al. 2013). It is reported in elite athletes, and that review does not establish how far down the field it extends.
The football study followed 29 English Premier League players across in-season training weeks (Thorpe et al. 2016), a period in which HRV itself showed no substantial or statistically significant changes. Morning ratings of fatigue, sleep quality and soreness were clearly more sensitive than heart-rate-derived indices to the daily fluctuations in session load, in that population and on that timescale.
What to do with your number this week
- Fix your source. A single device, metric and kind of reading.
- Get to 14 nights before judging anything. Five works, but the band comes out very wide.
- Look once a week, not every morning.
- When a night falls outside the band, look for a cause before you look at your plan. Alcohol, a late meal, a warm room, illness and yesterday's session cover most of them.
- Cross-check before you act. A low reading becomes a training decision only when your resting heart rate is up too and your legs agree — and even then, a few easier days is the answer.
All of it is spreadsheet arithmetic. If you would rather not, paste your nights into the HRV calculator: it draws the band and flags the outliers.
Sources & References
- (2017). An Overview of Heart Rate Variability Metrics and Norms. Frontiers in Public Health.
- (2013). Evidence of parasympathetic hyperactivity in functionally overreached athletes. Medicine & Science in Sports & Exercise.
- (2021). Heart Rate Variability-Guided Training for Enhancing Cardiac-Vagal Modulation, Aerobic Fitness, and Endurance Performance: A Methodological Systematic Review with Meta-Analysis. International Journal of Environmental Research and Public Health.
- (2016). Individual Endurance Training Prescription with Heart Rate Variability. Medicine & Science in Sports & Exercise.
- (2021). Validity of the Wrist-Worn Polar Vantage V2 to Measure Heart Rate and Heart Rate Variability at Rest. Sensors.